Bitmap Oscilloscope
By Ben Nitkin on


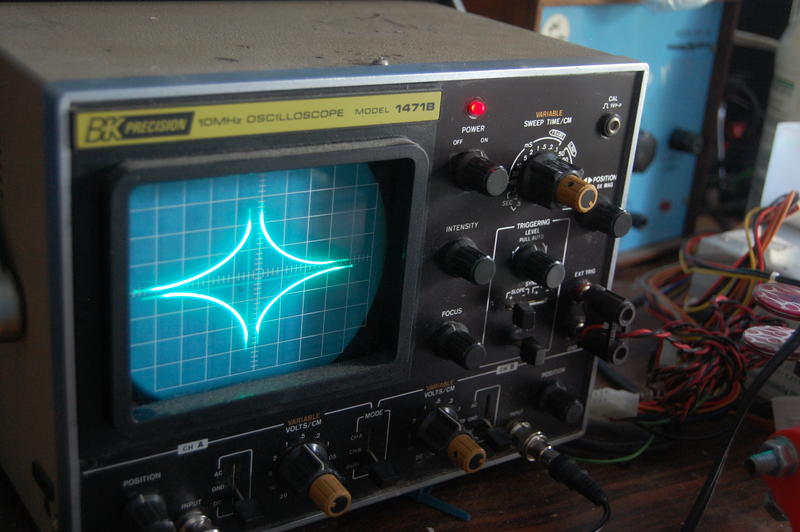
After drawing basic shapes on the oscilloscope (circles, lines, and rectangles), I decided to try something more adventurous: bitmaps. Since the soundcard outputs no more than 192,000 samples per second and the oscilloscope doesn't retain data for much longer than 1/60th of a second, I knew that only small images would work.
First, I needed to read images. The Python Imaging Library does an admirable job (and is free!). It works with most formats, and is capable of reading layered images (animation, for the layman). Most of my test images were GIF files, which posed a problem: GIF's are indexed. In an indexed image, each pixel has only a single value, rather than the usual three (red, green, and blue). The GIF includes a lookup table for translating that value into a color. Unfortunately, PIL doesn't include any way of running those numbers through the lookup table. Fortunately, it allows conversion to a normal RGB image.